- Find the Investor Dashboard for your project. This can be a link shared by the project, or you can browse this page in the Unvest app: app.unvest.io/projects
.png?fit=max&auto=format&n=ZPndW_DYd52BB9Sr&q=85&s=1db6620eb928e3c776e97e04c6406ad7)
- Connect your wallet and ensure you are on the correct network.
- On the Investor Dashboard, you will see two panels: “View token locks” and “View LP locks”.
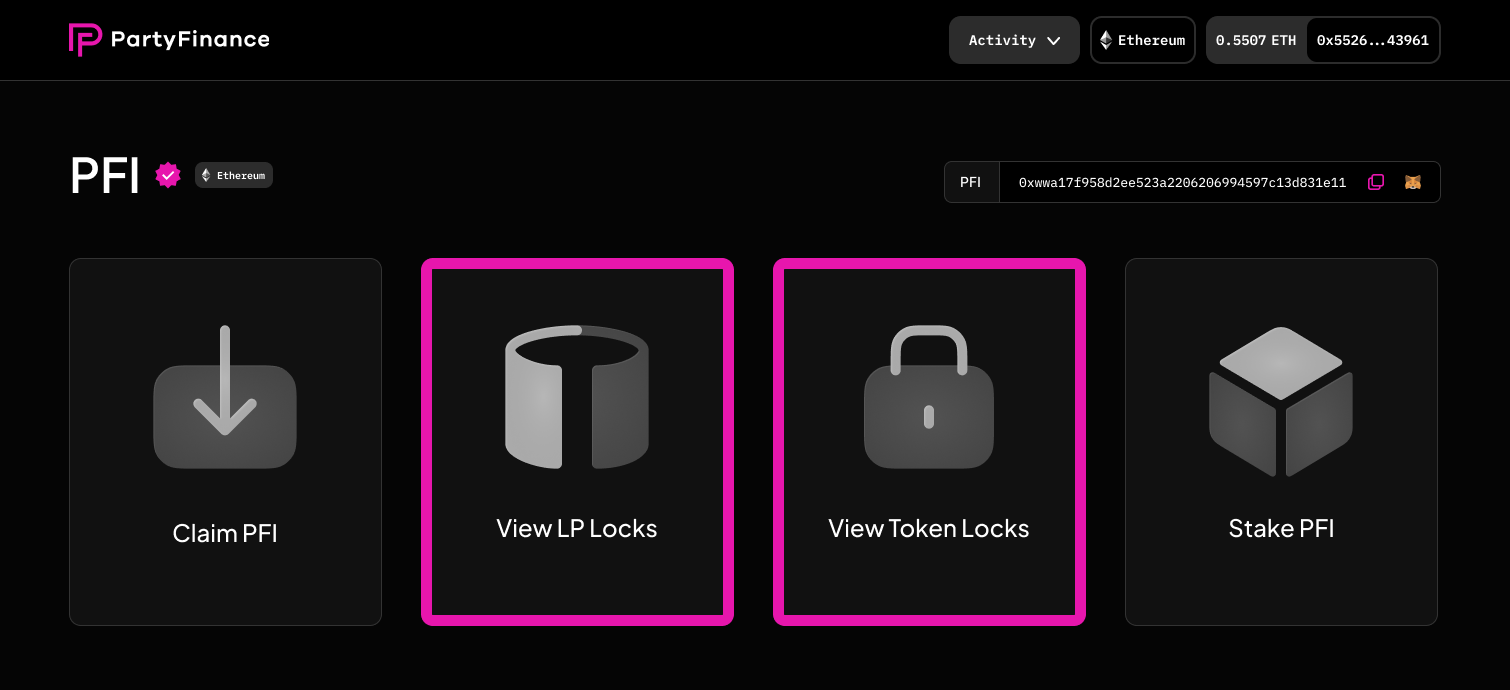
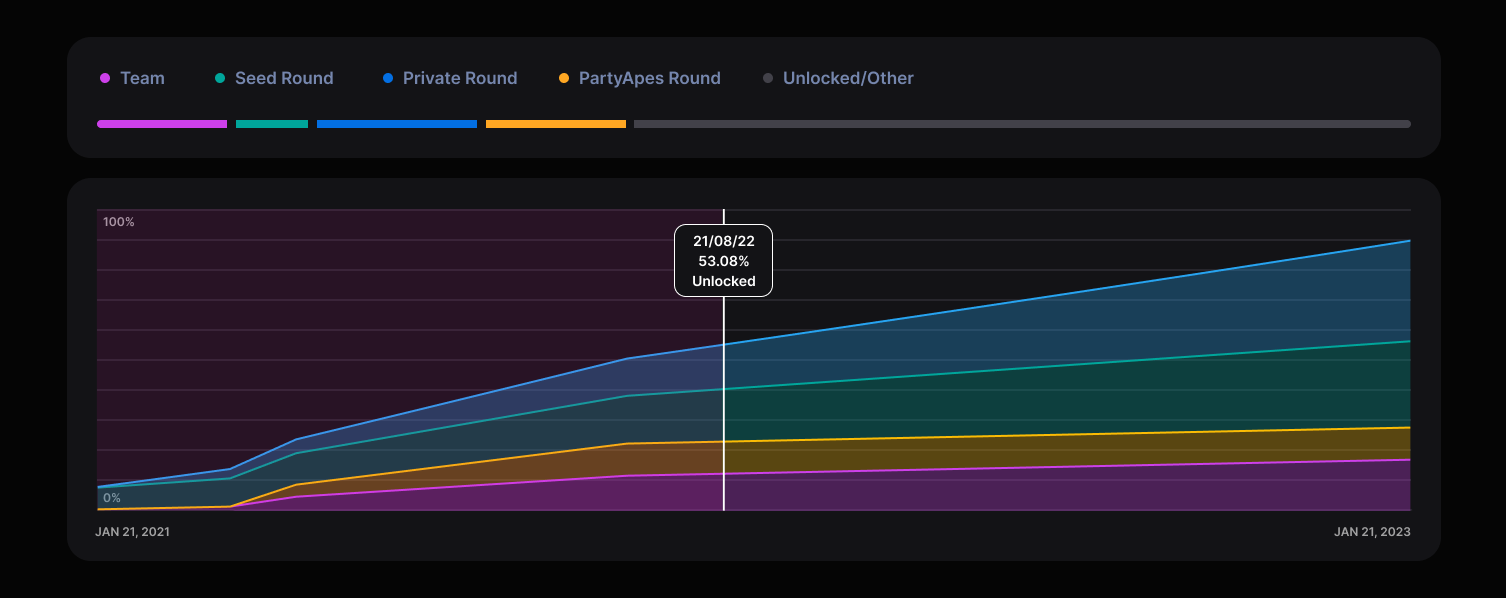
- To view team locks and other token distribution information, click on the “View token locks” panel. This will show you the entire token supply, the rate at which all tokens unlock, and the breakdown between different allocations such as team tokens, marketing tokens, etc.
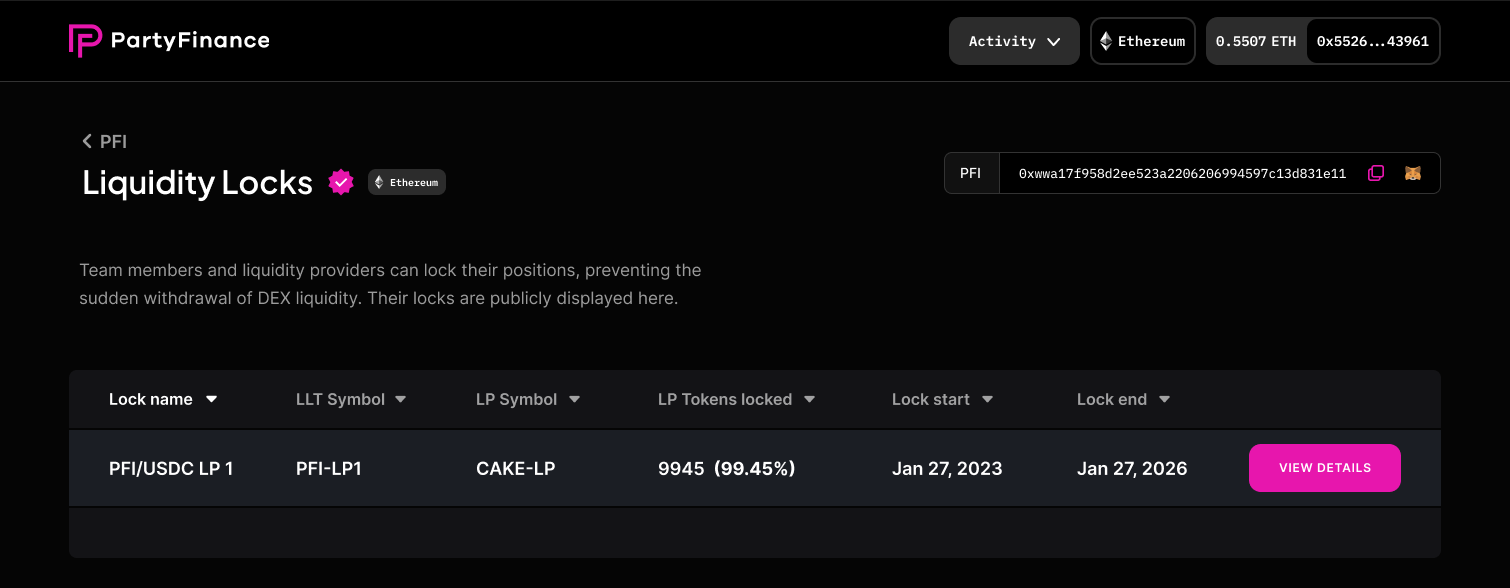
- To view liquidity locks, click on the “View LP locks” panel. This will show you all liquidity locks for the project, including the amount of tokens locked, the end date of the lock period, and the status of the lock. Click on a specific lock for more details.
- Note that if the project has tokens on multiple chains, there will be a separate page and separate statistics for each chain. Be sure to switch to the correct chain in your wallet in order to view the correct data.
Investor Dashboard Tutorials
Viewing Team locks & Liquidity locks
One of the key features of the Unvest Investor Dashboard is the ability to view and track the status of team locks and liquidity locks for a project.
Understanding the distribution of these tokens can provide important insight into the long term plans and financial health of a project. In this tutorial, we will walk you through the steps of viewing team locks and liquidity locks on the Investor Dashboard.